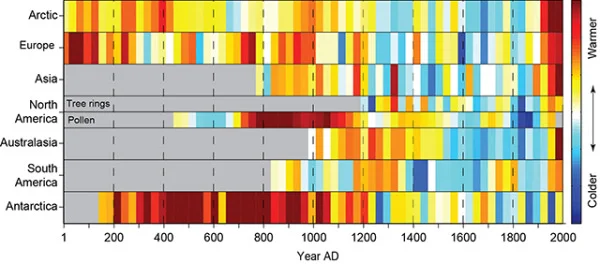
Earth's Temperature Timeline
A Timeline of Earth's Average Temperature is another great data visualization design by Randall Monroe at XKCD.com! Real data and a humorous take on historical events!
A Timeline of Earth's Average Temperature since the last ice age glaciation. When people say "The climate has changed before," these are the kinds of changes they're talking about.
It's a long design on purpose. That's what drives the context of the data so strongly. 22,000 years of small changes and major historical events and then "Oh shoot..."
Found on FlowingData


