The Logistics of Santa Claus

The Logistics of Santa Claus infographic from Go Supply Chain takes a fun look at what it would take for a modern shipping company to achieve the magic deliveries that Santa makes every year.
Ever wondered how Santa Claus does it all? In the festive spirit our logistics consultants decided to investigate. This fun infographic explores the options (besides Santa's sleigh) that could be used. We hope that you enjoy this infographic.
A good content strategy is to tie your business in with a holiday or major event. This keep the topic relevant to your business and entertaining to your audience.
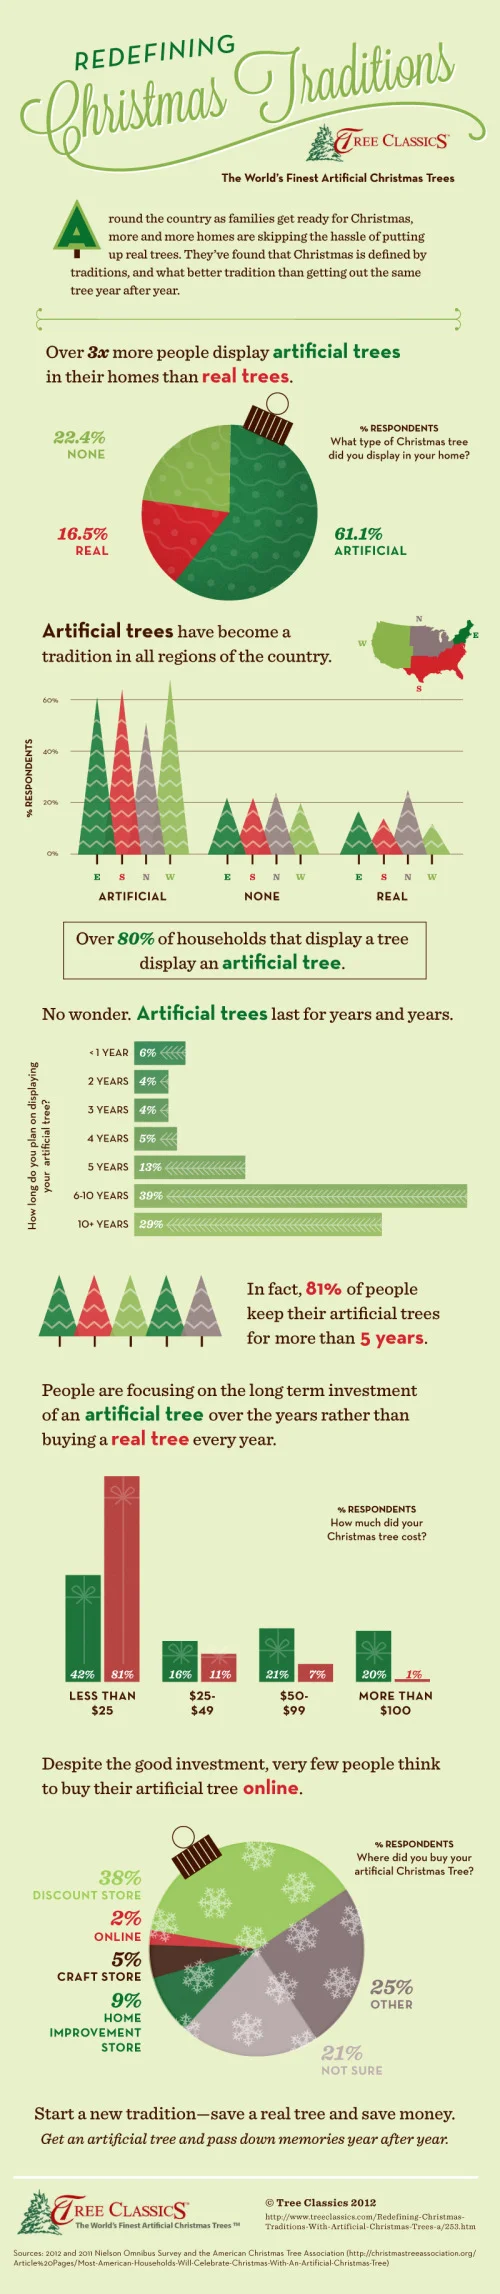
However, this design has a few major flaws! First, the pie charts are both bad. They add up to 173% and 167%, which is just bad data visualization design. Pie charts MUST always add up to a grand total of 100%. If we assume the data is correct, this type of data should never have been visualized as a pie chart.
Second, a number of the statistics are shown in text only. This misses the biggest advantage of infographics, which is an opportunity to visualize data for your audience. If you're not going to visualize the data, you might as well just post a text article instead.
Third, where are the data sources? Where is the copyright or Creative Commons license? Where is the URL to the company website and the infographic landing page?
Fourth, I can't find the full-size original online anywhere. It was posted on their blog at a smaller size which makes some of the text very hard to read. Their post should have linked to the full-size version.
This is a fun, engaging topic, but the infographic execution fall short.
Thanks to David for sending in the link.