Kim Rees and Dino Citraro - What Makes an Infographic Cool?
Guest Post by Kim Rees and Dino Citraro
When an Infographic Isn’t
Infographics are popular, useful, and seem to be an established part of our vernacular these days. They are easy to read, quick to digest, and for the most part, can require less work to create than a more in-depth data visualization. However, as with many things that are popular and useful, they have a dubious imposter that is frequently wrongly categorized.
Digital Posters
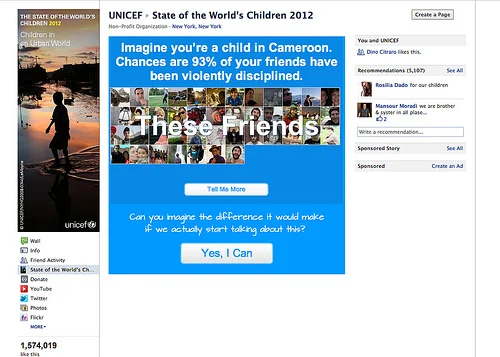
Digital Posters are everywhere and almost entirely presented under the auspices of being an Infographic. These distant cousins confuse the definition of an Infographic because while they often might be easy to read and quick to digest, they fail to expand the essence of the data by adding context and metaphor.
A collection of cats holding a variety of mobile devices may be adorable, but it is not an Infographic. A huddle of celebrities who all have a similarly peculiar personality trait might curious, but this also, is not an Infographic. Extremely large numbers surrounding nicely formed text treatments is not an Infographic.
All of these are examples of Digital Posters.
If You Want to Make an Infographic, Don’t Make a Digital Poster
You might still be confused by the revelation that not all things posing as Infographics are in fact genuine, but if it’s your job to create one, here are a few things to keep in mind:
Add Context
One of the most important things an Infographic can do is add context. Consider this example:
The illustration on the left represents the way this information would be presented in a Digital Poster. The illustration on the right shows the same information as an Infographic. Both of these start the same information, but the Infographic allows the viewer to glean a deeper understanding through the addition of context. A good example of a Digital Poster posing as an infographic can be seen here: http://think.withgoogle.com/databoard/
Expand Context Through the Use of Metaphors
Infographics can (and should) be enhanced through the use of metaphor.
Being stuck with a single number to display is maddening. How do you show size? What does its size even mean? This dilemma is an opportunity to add context and metaphor. By comparing a number to something else that is familiar, you create understanding.
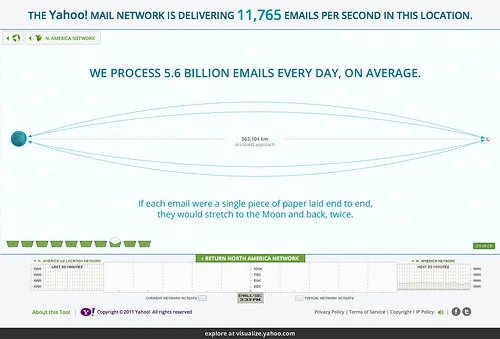
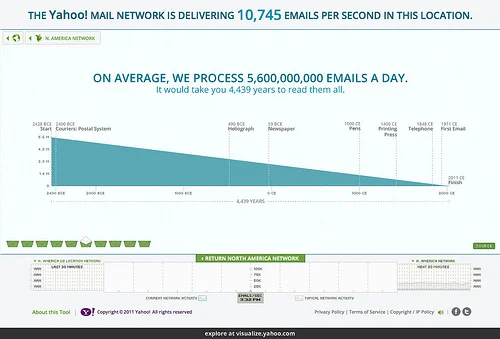
Here are some examples of adding context to the previous graphic:
http://www.flickr.com/photos/periscopic/6351350295/in/set-72157629247990061
Keep in mind that the context should match the subject matter. The examples provided above concern emails – or correspondence – and the metaphor will be most effective when it extends the topic. Making a comparison to a page of text and the time spent reading it are easy leaps of imagination because the viewer’s mind is already considering the concept of communication. If we had instead compared that number to the blades of grass in a field, the size of the field might end up being pretty large, but the goal of getting the viewer to imagine the scale of the emails requires a larger cognitive leap, and provides less impact.
By adding metaphor to data we add dimension. Through this abstraction we gain the ability to provide complex information in a way that is accessible to a much wider audience than that which might be familiar with the specific subject matter. In addition, metaphors not only provide an easy vehicle for empathy and comprehension, they are also an excellent opportunity to add visual interest.
Respect the Data
Data collectors are the historians of our time. The data revolution that started with affordable large storage devices is capturing our history in the finest detail we have ever known. The process of collecting it, specifically when it is done by real people, is difficult and tedious, and largely goes unnoticed. When you visualize data, you must respect what you have, and the enormous potential it represents. Even the simplest statistic deserves more than a passing thought, or an effortless grasp at the most obvious visual display that comes to mind.
Do More
When creating an Infographic, the data you present must do more as a graphic than if it were presented as a number or single line of text. Adjusting the size of your text, illustrating a word found within the text, or even showing the concept embraced by a cute illustration is not enough. If you believe the data has a story to tell, then you should do your best to tell it.
Know Your Options
Working with data is nuanced and requires an understanding of the appropriate types of data display. A single data set, or statistic, can potentially have multiple ways of being visualized. In the same manner, a single data presentation method can be used to display multiple types of data. Understanding the relationship between your data and your data presentation options is essential if you want to create effective Infographics.
Strive for Elegance and Clarity
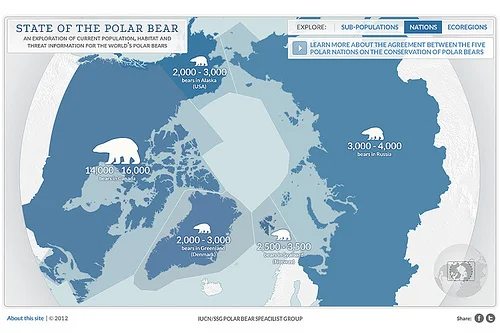
A natural tendency is to want to include every datapoint on the screen, assuming that more data will equate to more credibility. This is logical in spirit, but counterproductive in practice. Data design follows the same rules as visual design. Remove anything you can’t justify and isn’t relevant to the message you’re trying to convey. The empty spaces, the things you leave out, can provide clarity – and can also provide an opportunity to evoke questions in the viewer’s mind (that’s a good thing).
http://www.flickr.com/photos/periscopic/8004311938/in/set-72157631576836704
Use Emotion
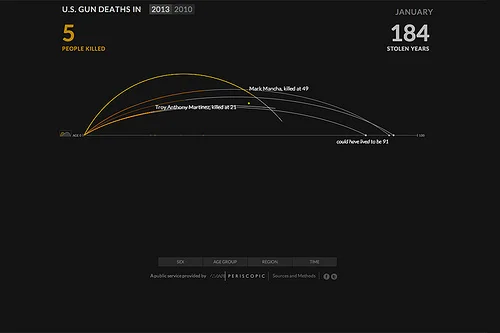
The best way to connect with people is to elicit an emotional response. No matter what the subject matter, visualizers need to have empathy for how people will feel when they reflect on the data we’re presenting. Sock, joy, sorrow, curiosity, and other strong emotional reactions likely illustrate that you’ve chosen an important dataset and are presenting it well. In many ways, the ultimate compliment an Infographic creator can receive is to know that a viewer of their work is being moved at a level that goes deeper than just an intellectual response.
http://www.flickr.com/photos/periscopic/8601076022/in/set-72157633115411317
Be Authentic and Sincere
Presenting datapoints without consideration for what they represent shows a lack of empathy. When you visualize data, it is essential to understand the role it plays in the larger social conversation. If it has the potential to change a person’s worldview, you need to do whatever you can to make this happen. Divorcing yourself from this responsibility is the sign of on uninspired designer. Imagine you are actually having a conversation with the viewer. Let your design choices begin a dialog.
http://www.flickr.com/photos/periscopic/6792935314/
Know the Difference
Data is easy to love. It represents truth and clarity, and can inspire people to grab whatever living thing is nearest to them and insist it listen. It can move a person to join a protest, to shout a slogan, or even inspire someone to make a poster. Even a digital one.
When we begin to discern between graphical representations of data and actual visualizations of data, we become better data consumers and better knowledge creators. There is a place for Digital Posters, it’s just not the same place as Infographics.
Kim Rees
Partner & Head of Data Visualization (@krees)
Kim Rees is Head of Information Visualization at Periscopic, and is a prominent individual in the data visualization community. She has presented at several industry events including Strata, OSCON, Wolfram Data Summit, VisWeek, Tableau User Conference, NY Hacks/Hackers, and Portland Data Visualization among others.
She is an advisor to the US Congressional Budget Office. Kim has published papers in Parsons Journal of Information
Mapping, was an award winner in the VAST 2010 Challenge, and is a guest blogger for Infosthetics and FlowingData.
Recently, she was the Technical Editor of Visualize This, by Nathan Yau of FlowingData. She was a judge on the WikiViz Challenge 2011 and CommArts Interactive Annual 2012.
Dino Citraro
Partner & Head of Strategy (@dinocitraro)
Dino Citraro is Head of Strategic Design and Operations at Periscopic, and has a strong background in problem solving, creative direction, and writing.
A twenty-year veteran of the multimedia industry, his work has spanned immersive online development, application design, interactive motion pictures, multi-player games, and interactive hardware installations.
He is the Visualization Editor of the Big Data journal, as well as a contributing blogger to several industry sites. He is also an accomplished photographer, a published poet, and has written & illustrated seven children’s books.


